Health Checks for REST/gRPC APIs: Kubernetes and Beyond


Is your API working right now?
It can be a tough question to answer. A lot of monitoring tools are out there,
like Prometheus which can track all sorts of metrics,
but that assumes metrics are being sent to it which let you know there’s a
problem. Maybe NewRelic can track response times, and
Rollbar can track exceptions, but there could be a lot
of things relating to "application health” which do not fall into those
categories.
Application health is an important difference to test suite success. Test suites
confirm that the code you’ve pointed some tests at work with the environment
variables in your test suite, but that doesn’t mean that same code will work
with different environment variables.
Some people confuse application health with "server health”, but that is rather
different. Server health is knowing things like the amount of disk space or
memory that your server has left, and reporting that the database is running
perfectly. This is easily solved with tools like
collectd, which can shuffle these metrics back to
collectors like Prometheus. Unfortunately that doesn’t mean your application
knows how to talk to that perfectly functioning database.
To get a current snapshot of the health of a specific application (even if its
only the specific instance you happen to get routed to when you make that HTTP
request), there are a lot of tools which help you expose some sort of "health
check endpoint”. Every programming language seems to have a prominent tool for
doing this, at a totally different endpoint, with a totally different payload.
- Ruby: OkComputer runs on
/okcomputerwith a mega-response - Python:
health-check has a bunch of various
/api/health/databaseendpoints - Java/Spring Boot:
Actuator adds/health,
/metrics, and/info
Whatever language/framework you use, one of these tools is probably a good idea.
As somebody working at a company with a whole bunch of languages being used, I
still somehow have delusions of having consistency across those various systems.
Luckily there is a draft RFC HTTP response format for health
checks, which anyone can conform
to right now.
Sure draft RFCs are not final RFCs, but if people do not implement the drafts,
they never become final RFCs. Check out
Sunset
for another important draft RFC.
Each of those tools need to start supporting "formats”, and there should be a
"legacy” format (whatever they currently have), and a "RFC HealthCheck” format
which supports this draft RFC.
Using these tools has allowed departments at WeWork to build internal "Status
Dashboards” that let support staff have great insight into the status of various
applications. Especially if the health checks go beyond the standard "database”
and "cache” checks, and start reporting circuit breaker statuses for other
services.
Kubernetes Cares about Application Health
Above we talked about making a health endpoint that we could hit up for a status
page or whatever, but how about if we knew that health status before we
deployed?
If you happen to be using Kubernetes, you can use HTTP-based readiness probes, which make sure that application doesn’t make it into rotation in the load balancer until it is ready. After it becomes ready, if at any point in the future it seems to be suffering, Kubernetes will remove it from the load balancer automatically!
Kubernetes pods have a whole lifecycle, but basically pods are created, and remain as "pending” until they are "ready”. Once a pod the pod is considered "ready” it will be placed in the load balancer for that service, and it will start accepting traffic. When a new pod is placed into the load balancer, a corresponding pod for that service from a previous release will be removed. If a service has multiple pods it will do this one at a time, and as each new pod becomes ready a corresponding old one will be removed until the new release is complete.
Exactly how Kubernetes determines a pod to be ready depends on how the readiness probe was configured the your Helm chart, specifically in <yourapp>-chart/templates/<service>-deployment.yaml
spec:
  containers:
    - name: yourapp-web
  ports:
    - containerPort: {{ .Values.service.targetPort }}
      name: {{ lower .Values.service.targetProtocol }}
      protocol: TCP
  readinessProbe:
    httpGet:
      scheme: {{ upper .Values.service.targetProtocol }}
      path: /health
      port: {{ .Values.service.port }}
  initialDelaySeconds: 5
  timeoutSeconds: 2
This is telling Kubernetes to wait 5 seconds, then try and send a HTTP GET
request to /health. If that endpoint returns a HTTP response code is between
200 and 399 then the pod is considered ready. If it returns any other status,
then it will stay as "pending”, and another probe will be send later on.
Another type of probe is "liveness”. Once a pod has been defined as ready, it is
then live, until a liveness check decides it is not live. This could mean the
server crashed, the pod ran out of memory, or any one of many other things that
can cause code to fail. A liveness probe works just the same as a readiness
probe, and accepts the same configuration.
Different Types of Probe
There are three different types of probe that can be used by Kubernetes:
tcpSocket
A TCP probe just checks that a process is listening on that port and accepting
TCP connections, it does not confirm that whatever is listening (and its related
dependencies) are fully booted. If a pod is considered ready prematurely it will
replace a fully functioning pod from the previous release with a pod that is not
yet ready for traffic. For this reason, a TCP probe should only be used for
processes that do not start listening until initialization is complete.
httpGet
A HTTP probe is preferable for any HTTP-based applications, like a REST API, web
UI, etc. If the application has a fully functioning web server, and the health
endpoint is written to check the important dependencies are available to it,
then we should have strong confidence the pod is ready.
The HTTP response status code should be between 200 and 399, and bonus points
for HTTP applications that return a body that conforms to RFC Draft: Health
Check.
exec
Exec is a fantastic "other” option, which does not rely on TCP or HTTP at all.
For example, Redis could be implemented as a TCP check, but it is so much better
handled with an exec probe:
livenessProbe:
  exec:
    command: ["redis-cli", "ping"]
  initialDelaySeconds: 15
  periodSeconds: 5
readinessProbe:
  exec:
    command: ["redis-cli", "ping"]
  initialDelaySeconds: 15
  periodSeconds: 5
If the redis-cli ping command fails, it will not be ready, or stop it from
being live, and that has a lot more intelligence built in than a simple TCP
check.
This is also useful for gRPC APIs. Seeing as they are not pure HTTP, they need
special handling. For a long time there were three fairly awful choices:
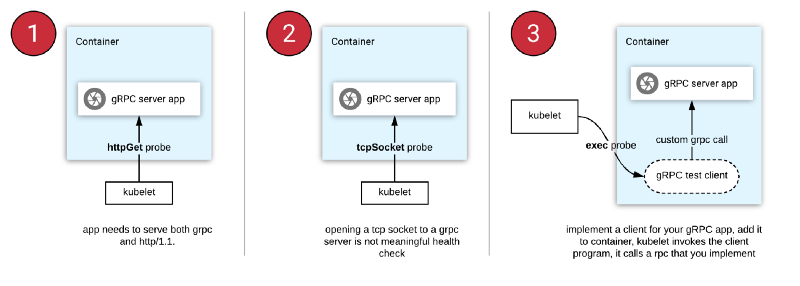
- httpGet means you have to set up a HTTP/1.1 bridge for an otherwise HTTP/2-only app
- tcpSocket means you might have traffic directed to a pod which is not yet truly ready, meaning you blue/green deployments are looking a bit brown
- You built some special snowflake exec based checking, which involves special documentation and monitoring
Since gRPC v1.15 there is a standardized approach to exec health
checks!
This serves as a warning that using non-standard API implementations means you
need non-standard solutions. gRPC only got a standard for doing this recently,
and implementing it needs awkward treatment in Kubernetes.
If you use GraphQL there still isn’t really a plan. Googling "graphql health
checks” somebody is just tweeting about maybe automating a simple query.
Standards are great folks!
When I write about the differences between REST and Other
Implementations™
and say things like "standard HTTP things do not work for GraphQL/gRPC”, this is
the sort of thing being discussed. Over time implementation specific solutions
are created and there are various workarounds floating about, but ignoring the
conventions of HTTP can lead to complications. If you understand the pros and
cons, and are willing to get involved with all that, then fair enough. But don’t
forget about this non-standardness when deciding between various paradigms or
implementations!